Poster Presentation 21st International Conference on Biological Inorganic Chemistry 2025
A map of natural product and synthetic chelators in chemical space (#503)
Natural product chelators are considered more structurally complex relative to their synthetic counterparts, however, this difference in chemical space has not been described or quantitated. This work aims to map the chemical space of known natural product and synthetic chelators using relevant descriptors and principal component analysis (PCA) and to use this tool to discover new chelators. The Cambridge Structural Database (CSD), Protein Data Bank (PDB), and the recently published SIDERITE database of siderophores, a class of bacterial iron chelators were split between a natural and a synthetic dataset using the COCONUT, LOTUS, and Supernatural 3.0 natural product databases1. Molecular descriptors relevant to the structural features of chelators were isolated from general descriptor sets MACCS keys, Mordred descriptors, and PaDEL, with additional descriptors included from the literature. The map of chemical space presented by the PCA (Figure 1) of the descriptors showed that the natural and synthetic chelators had a region of significant overlap but displayed different trends. Analysis of the descriptors showed that the two groups held unique distributions, with natural products having lower logP values, greater numbers of hydrogen bond donor and acceptor atoms, and a higher proportion of oxygen atoms. In natural product chelators the molecular weights, atom/bond polarizabilities, Bertz complexity index, and Böttcher’s complexity all had a lower peak of distribution than synthetic chelators but a broader tail towards higher values2. Using chelator binding motifs and connectivity from the CSD we found possible natural products chelators and propose new metals binding to known chelators. We conclude that natural product chelators are distinct from synthetic chelators according to descriptors relevant to the design of novel chelators with new potential in metal-based applications.
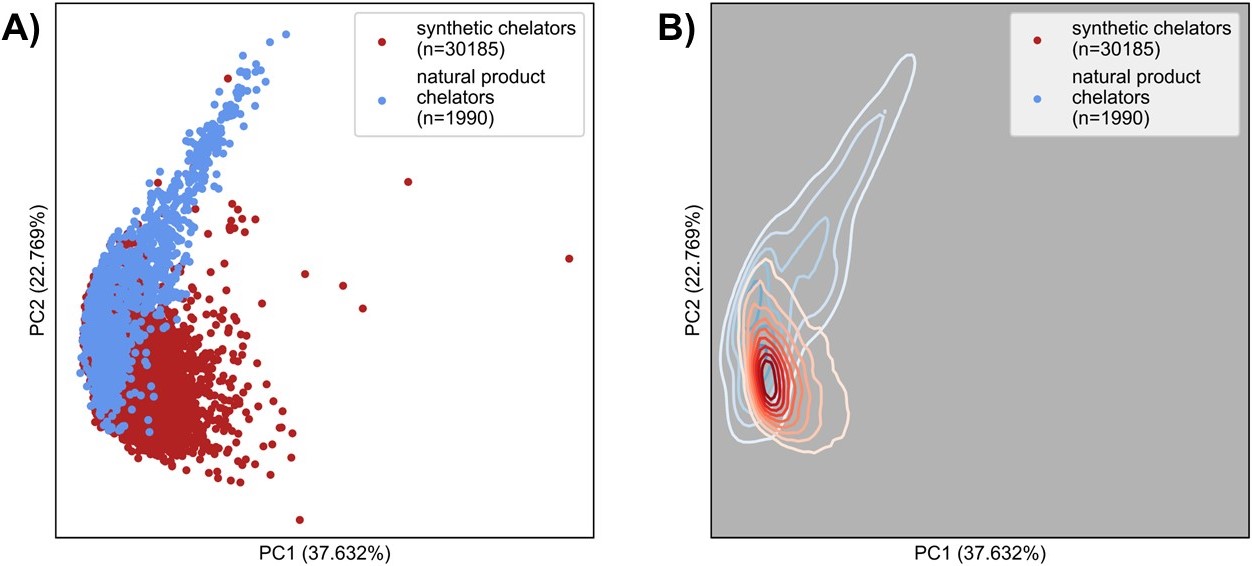
Figure 1. A) Chemical space of natural product (blue) and synthetic chelators (red). Chemicals space is mapped according to the principal component analysis of descriptors defined in the study. Axes show the percentage of information contained within each principal component. B) kernel density estimate of A).
- (1) He, R., S. Gu, J. Xu, X. Li, H. Chen, Z. Shao, F. Wang, J. Shao, W.-B. Yin, L. Qian, Z. Wei and Z. Li. iMeta 3(2), 2024, e192.
- (2) Böttcher, T. Journal of Chemical Information and Modeling, 2016, 56(3): 462-470.